In FY2024, the U.S. approved nearly 400,000 H-1B petitions, underscoring how central these visas remain to America’s ability to import high-skilled talent. But at the same time, the H-1B program is facing one of its sharpest jolts yet: the Trump administration has introduced a $100,000 one-time fee on new H-1B visa petitions, arguing it’s needed to curb abuse and protect American workers.
Against this backdrop, the FY2024 data doesn’t just tell us who got hired, it also offers a snapshot of what the stakes are under this new paradigm.
(Note: all the data is taken from the Government’s Official Website for US Citizenship and Immigration Services: https://www.uscis.gov/ )
1) Who Took Home the Biggest Paychecks?
Every year, the H-1B program throws up winners and laggards when it comes to salaries. Some professions clearly cash in on the specialized skills they bring, while others lag far behind, reminding us that not all visas are created equal when it comes to compensation.
Stats of Annual Compensation of H-1B Employees (Occupation-wise):
- Top of the table: Law & Jurisprudence — median pay above $215,000.
- Medicine & Health showed huge variability: from $69k (25th percentile) to $250k+ (75th percentile).
- Bottom earners: Religion & Theology workers at a median of $54,000; entertainment and miscellaneous categories also hovered low in the $50k–$80k range.
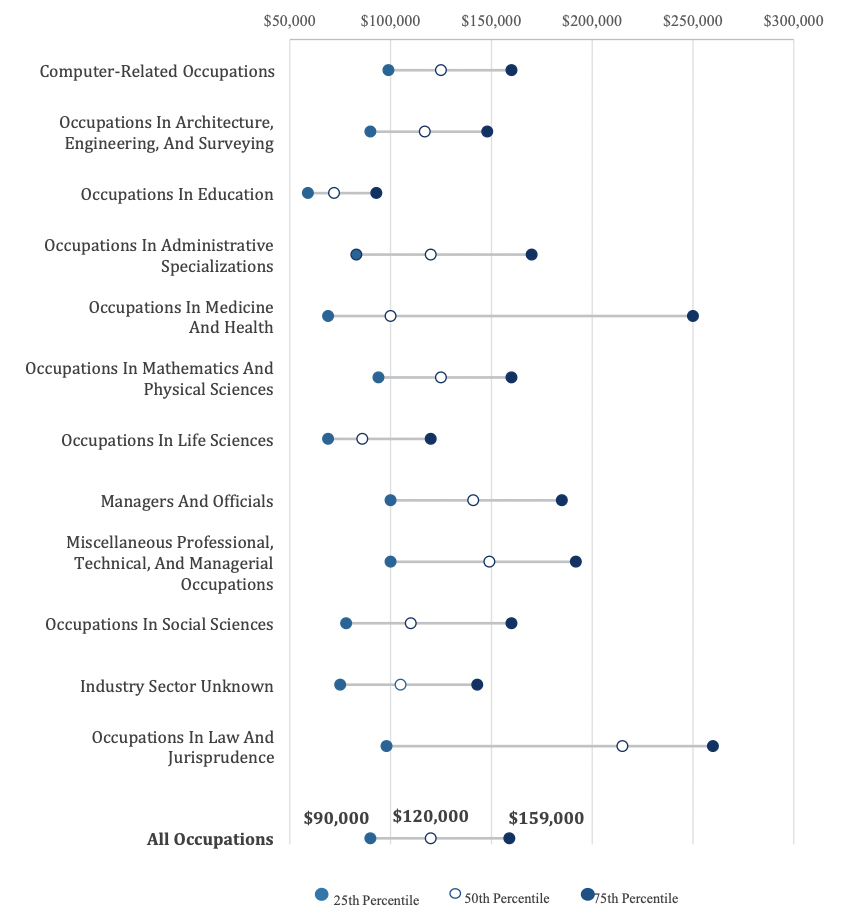
Summary:
At one end of the H-1B ladder sit attorneys and doctors, commanding six-figure packages. At the other, clergy and entertainment professionals barely scrape past median U.S. wages. The program reflects America’s pay hierarchy as much as its skills demand.
2) Which Industries Hired the Most?
H-1Bs don’t just go to Silicon Valley, though tech still dominates. Looking at the approvals by industry, we see the backbone sectors of the American economy pulling in international talent where they need it most.
Stats of Industries that Got Highest Approvals of H-1B:
- Professional, Scientific & Technical Services: nearly 192k approvals (48%).
- Manufacturing: ~44k approvals (11%).
- Information (tech, media, telecom): ~36k approvals (9%).
- Finance & Insurance: ~32k; Education: ~28k; Retail: ~20k; Healthcare: ~16k.
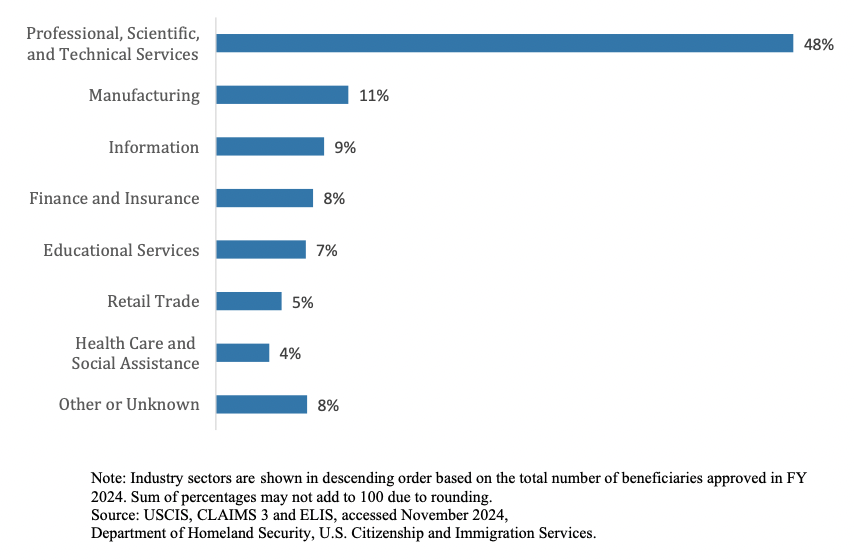
Summary:
Almost half of all H-1Bs go to scientific and technical services, proving that “STEM” isn’t just a buzzword, it’s the beating heart of the program. But the spread across finance, healthcare, and education also shows how dependent diverse sectors are on imported talent.
3) Where Did the Workers Come From?
Despite being open to the world, the H-1B program has long been dominated by a handful of countries. FY2024 is no exception — with one country towering over all others.
Stats of Top Countries that had the Most H-1B Visas:
- India: ~283k approvals (71%).
Of these, ~80k were first-time H-1Bs, while the rest were extensions. - China: ~47k approvals (12%), far behind India but a steady #2.
- All other countries combined shared less than 20%.
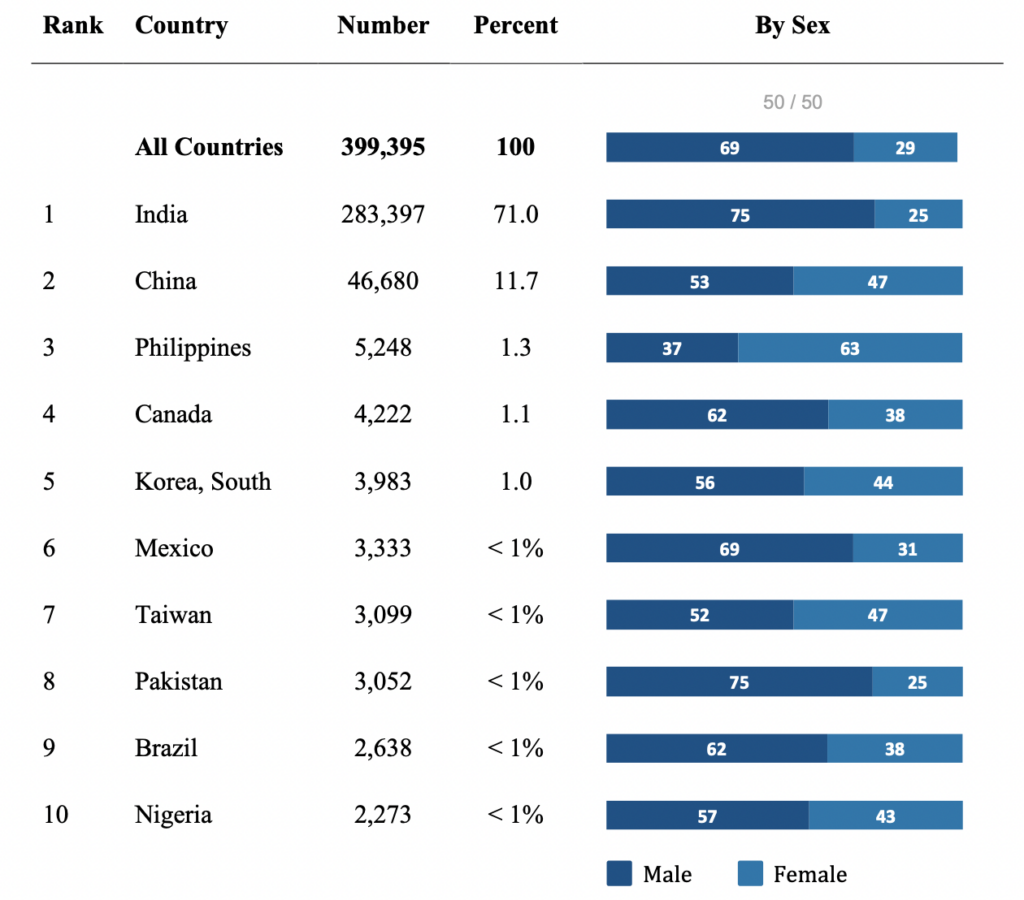
Summary:
The H-1B story is still largely an India story. With seven in ten approvals, Indian professionals remain the backbone of America’s specialty visa pipeline, while China’s numbers confirm its position as a distant second.
4) Gender Divide
The data reveals a gender imbalance that continues to shadow the H-1B program. While strides are being made, the pipeline still leans heavily male.
Stats of Gender Split among H-1B Holders :
- Overall split: ~70% male / 30% female.
- Initial approvals: ~37% female.
- Continuing approvals: only ~26% female.
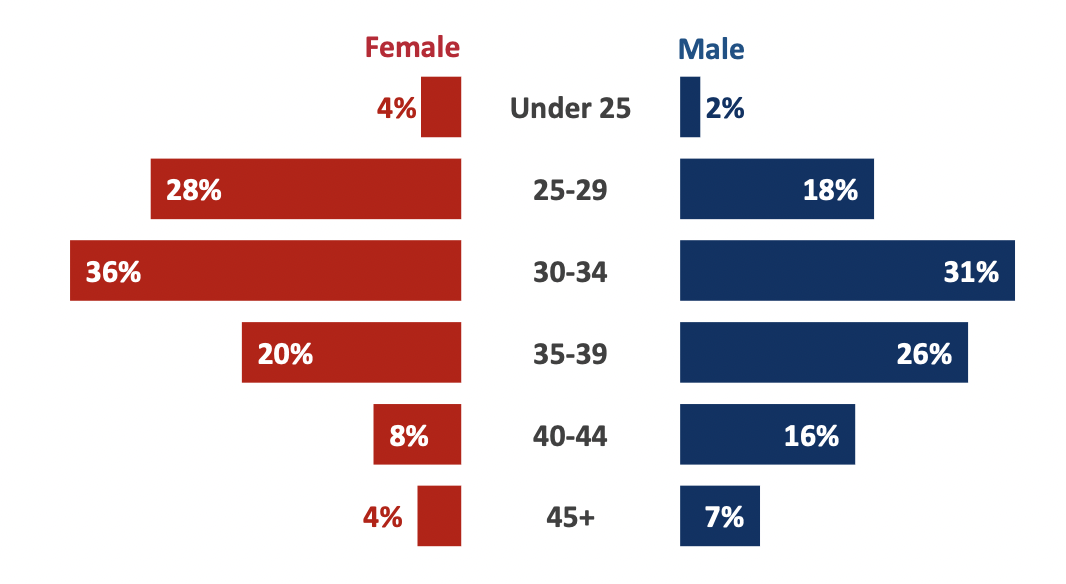
Summary:
Women are still underrepresented, though new entrants show better balance than renewals. The numbers hint at a generational shift, but the road to parity is long.
5) Education Levels
Who gets approved? Largely the highly educated. The H-1B isn’t an entry-level program — it’s tilted toward advanced degree holders, especially in STEM.
Stats of Education Qualification of H-1B Holders:
- Master’s degree: ~46% of approvals.
- Bachelor’s: ~33%.
- Doctorate: ~8%.
- Professional degrees (law, medicine, etc.): ~3%.
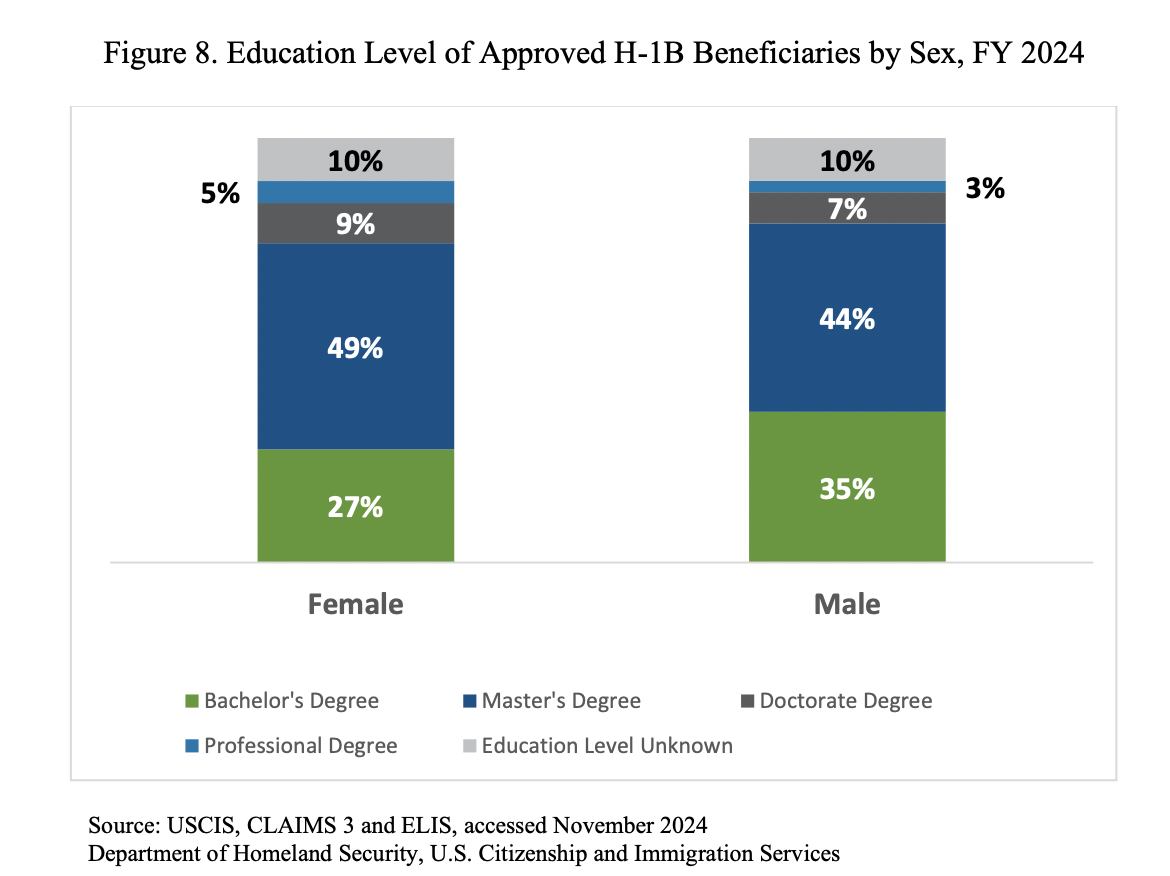
Summary:
Nearly 9 in 10 approvals went to candidates with at least a bachelor’s, and almost half with a master’s. H-1Bs are not just foreign workers — they’re foreign specialists.
6) By Occupation
When you zoom in on occupations, the H-1B program’s DNA becomes clear: it’s a tech program, first and foremost, with engineering and education riding behind.
Stats of Job Categories with Most H-1B Approvals:
- Computer-related jobs: ~255k approvals (64%).
- Architecture & Engineering: ~41k (10%).
- Education: ~24k (6%).
- Admin specializations: ~22k (5%).
- Medicine & Health: ~17k (4%).
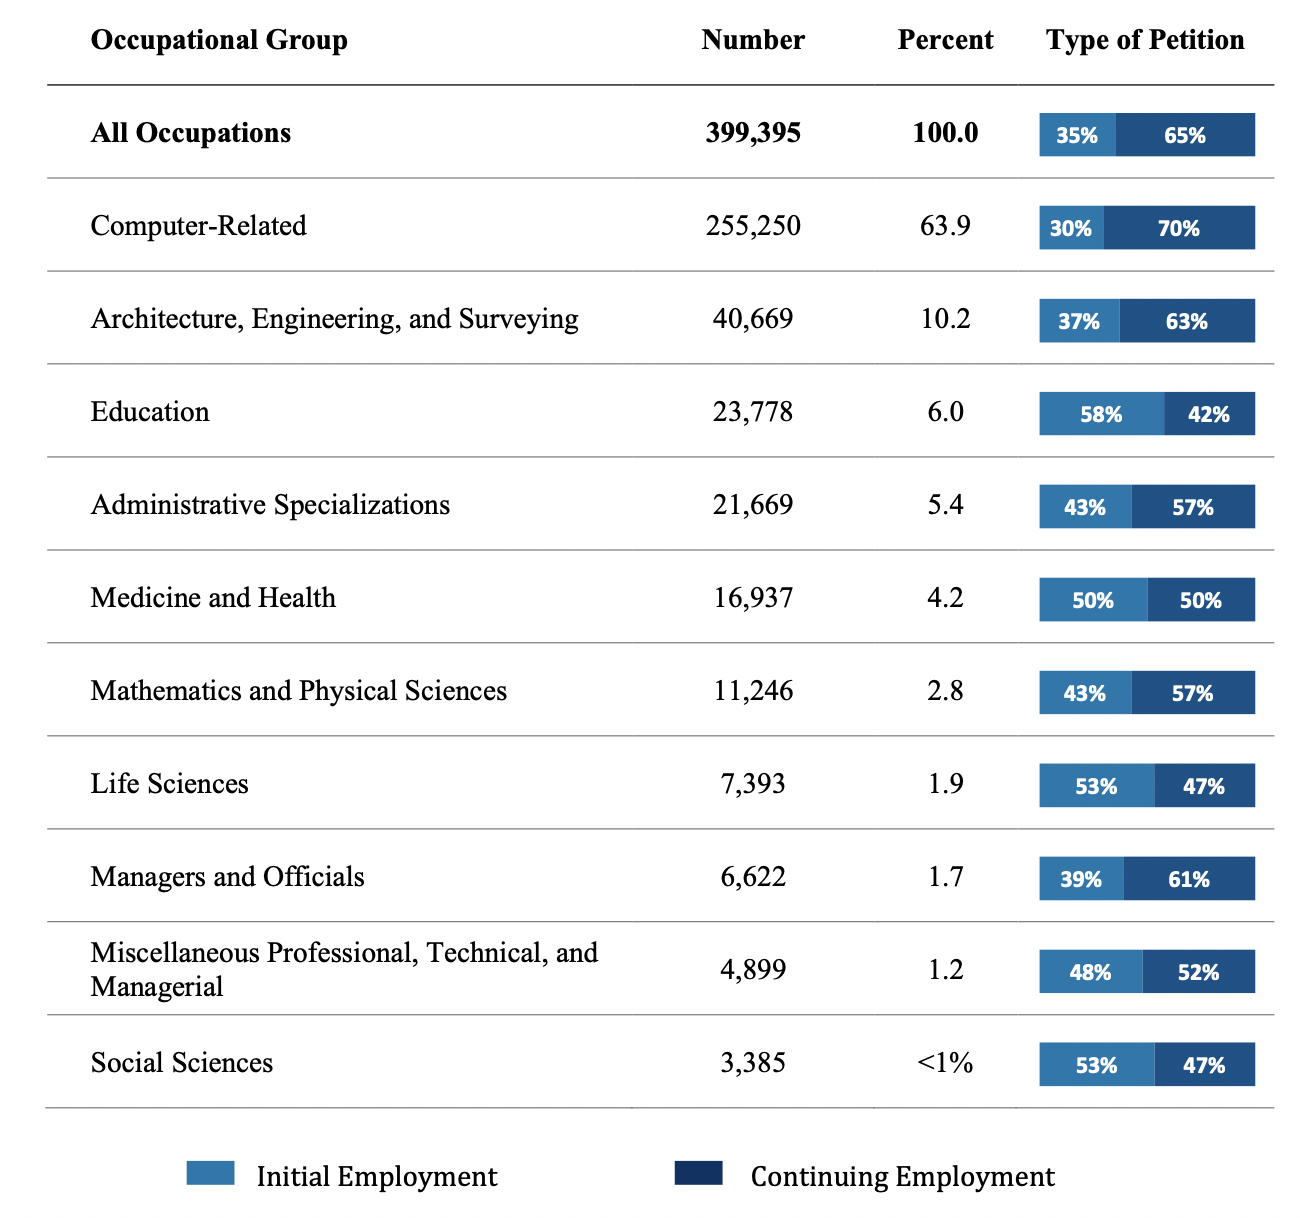
Summary:
Two out of three H-1Bs go to computer professionals, a stark reminder that the program is America’s most important tech visa. Other sectors, while significant, barely scratch double digits.
8) Visa Validity Periods
An H-1B isn’t forever, it’s a temporary work visa with defined validity. The data shows most workers are in it for the medium haul.
Stats of Validity Period of H1B Visas:
- 89% of approvals valid for 2–3 years.
- 8% valid for 1–2 years.
- 3% for less than a year.
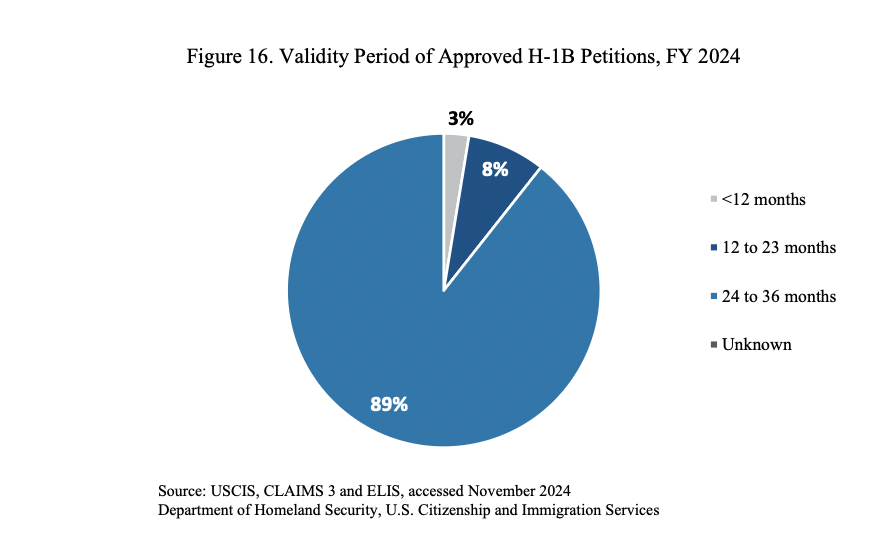
Summary:
The H-1B remains a stop-gap, not a permanent solution. Nearly nine in ten approvals carry 2–3 years of work authorization — a ticking clock that fuels the recurring immigration debate.
(Note: all the data is taken from the Government’s Official Website for US Citizenship and Immigration Services: https://www.uscis.gov/ )
Wrapping Up
The FY2024 H-1B data confirms long-standing trends: Indian professionals dominate the approvals, tech/engineering roles command the largest share, and compensation varies widely by occupation. But now those established patterns face a potential sea change.
With the newly imposed $100,000 fee on new H-1B petitions, every metric — from number of applications to employer willingness to hire globally, could undergo disruption. As reporters and analysts dig into the numbers, they’ll be watching not just who did get visas — but who, going forward, can afford to chase them.