



















Explore our Healthcare Technology Offerings Citrusbug Healthcare → Citrusbug Healthcare →
Let’s Talk
Data and Analytics Engineering

Business Intelligence Solutions Built on Governed Metrics

Our business intelligence solutions bring data, reporting, and business definitions into one governed architecture. Metrics are defined at the semantic layer and carried consistently from warehouse to dashboard, giving teams a reliable foundation for reporting, analytics, and AI.

Hero Image
500+
Projects Delivered
98%
Client Retention

SOC 2 SOC 2
ISO 27001 ISO 27001
GDPR GDPR
HIPAA HIPAA

Trusted By Industry Leaders

Bosch
Deloitte
eClinicalWorks
Epic Systems
Flipkart
McKinsey
HSBC
Softbank
Allianz
Airbnb
United Health
Phelic
Sun Pharma
Target
US Foods
Advinow

Certifications and Accreditations

Building BI That Teams Actually Trust and Use

BI penetration has been stuck between a quarter and a third of the workforce for more than fifteen years, and it has barely moved despite every generation of tooling promising self-service. The reason is rarely the tool. Finance calculates net revenue one way, the sales dashboard calculates it another, and once a leadership team catches that discrepancy in a live meeting, both dashboards lose their audience permanently.

That is a definition problem. It gets solved upstream, in structured business analysis and requirements work that names a single accountable owner for every metric before anyone opens Power BI. It is slow, unglamorous, and easy to skip. It is also the part of a BI programme that determines whether anyone uses the result twelve months later.
Metric Drift Across Tools

The same measure is redefined inside each report, each notebook, and each spreadsheet export. Nobody can say which version is authoritative because no version was ever declared authoritative.

Dashboard Sprawl Without Ownership

Report counts grow into the hundreds while usage concentrates on four or five. Retiring the rest is politically impossible because no owner is recorded against any of them.

Refresh Failures Nobody Sees

Scheduled refreshes fail silently; the dashboard keeps serving yesterday’s data, and someone makes a pricing decision on stale numbers. Alerting on freshness is treated as optional until it isn’t.

AI Answers Nobody Can Verify

Copilot and agent-based assistants generate confident answers from ungoverned tables. When the answer is wrong, the failure traces back to business logic the agent was never given, not to the model.

Business Intelligence Services We Deliver Across the Stack

Our business intelligence services cover the full path from source system to governed answer. Each engagement scopes only the layers you actually need, since most enterprises already own two or three of them.

Data Warehouse and Lakehouse Build

Modelling and building the warehouse layer on Snowflake, Databricks, BigQuery, or Microsoft Fabric, with dimensional models designed for query performance rather than reproduced straight from source system schemas.

Pipeline and Integration Engineering

Connecting ERP, CRM, billing, and operational systems through ETL and data integration pipelines that carry schema-change detection and failure alerting, so a silent upstream change does not surface as a wrong number three weeks later.

Semantic Layer and Metric Modelling

Defining measures, dimensions, joins, and grain in dbt Semantic Layer, Snowflake Semantic Views, Cube, or Fabric semantic models, version-controlled in Git so every metric change is reviewable and every consumer inherits it at once.

Dashboard and Report Development

Building reports in Power BI, Tableau, Looker, or Metabase against the semantic layer rather than against raw tables, which keeps report logic thin and makes retiring or rebuilding a dashboard a low-risk task.

Predictive and Forecasting Models

Extending descriptive reporting into forecasting and decision intelligence models for demand, churn, claims severity, and capacity planning, with model outputs written back into the warehouse as governed measures.

Embedded and Customer-Facing Analytics

Shipping analytics inside your own product or customer portal with row-level tenant isolation, so your users see their data only, and your commercial team gets an analytics tier it can actually price.

Migration From Legacy BI

Moving off SSRS, Cognos, BusinessObjects, or an unmanaged Power BI estate. We inventory what is genuinely used, rebuild those assets against governed definitions, and retire the rest with an audit trail.

Platform Support and Optimisation

Ongoing capacity tuning, refresh scheduling, query cost control, and licence right-sizing, run by the same data engineering teams that built the platform rather than handed to an unfamiliar support desk.

Not Sure Which Metrics Your Teams Trust?

We’ll review the definitions, ownership, and reporting behind your critical business metrics.

Talk to a BI Expert

Inside a Governed Semantic Layer for Enterprise Analytics

Named Metric Ownership

  • Every measure carries a named business owner, a written definition, and a change history. When someone disputes a number, the conversation ends in the semantic model, not in a two-week reconciliation exercise.

Version-Controlled Business Logic

  • Metric definitions live in Git with pull requests and review, so a change to how churn is calculated is proposed, reviewed, and released deliberately rather than edited into a single report by whoever noticed first.

Governed Access at Query Time

  • Row-level and column-level security is enforced in the semantic layer rather than duplicated per report, which means a new dashboard inherits the correct access rules instead of requiring them to be rebuilt and retested.

Tool-Agnostic Consumption

  • The same definitions serve Power BI, Tableau, notebooks, embedded product analytics, and increasingly AI agents connecting through Model Context Protocol. One definition, many surfaces, no divergence.

Certified Metric Catalogue

  • A published catalogue distinguishing certified measures from experimental ones, integrated with data governance programmes so business users can tell at a glance which number is safe to put in a board deck.

Business Intelligence Solutions Across Regulated Industries

Industry changes what a metric means. Loss ratio, days in AR, and perfect order rate are not interchangeable KPIs with different labels; they carry different source systems, different regulatory constraints, and different owners.

Healthcare and Life Sciences

Clinical, financial, and operational data often sit across disconnected systems. We bring them together into a governed analytics environment that gives teams consistent measures across care, revenue, and operations.

Explore →
Healthcare Analytics
  • Check Icon Days in AR tracking
  • Check Icon Clean claim rate
  • Check Icon Payer mix analysis
  • Check Icon Reimbursement variance analysis
  • Check Icon Bed occupancy reporting
  • Check Icon Quality measure tracking
  • Check Icon Clinical trial performance
  • Check Icon Staffing cost benchmarking
Systems and Standards We Connect
HL7 v2 and FHIR R4B Epic and Cerner extracts X12 837 and 835 HIPAA-aligned access controls

Banking and Lending

Risk, treasury, lending, and commercial teams often report from different data snapshots. We consolidate banking, origination, and servicing data into one governed layer with traceable reporting and consistent measures.

Explore →
Banking Analytics
  • Check Icon Portfolio exposure reporting
  • Check Icon Delinquency and roll rates
  • Check Icon Net interest margin
  • Check Icon Cost of funds analysis
  • Check Icon Origination funnel conversion
  • Check Icon Expected credit loss
  • Check Icon Branch performance reporting
  • Check Icon AML alert analytics
Systems and Standards We Connect
Core banking systems Loan servicing platforms Payment and card feeds Credit bureau integrations SOC 2 audit logging

Logistics and Supply Chain

Operations teams rely on real-time signals while finance often works from monthly reports. We connect operational and financial data so shipment costs, inventory, carrier performance, and fulfilment metrics remain consistent.

Explore →
Supply Chain Analytics
  • Check Icon On-time delivery tracking
  • Check Icon Perfect order rate
  • Check Icon Shipment cost analysis
  • Check Icon Warehouse throughput reporting
  • Check Icon Inventory ageing analysis
  • Check Icon Carrier performance scorecards
  • Check Icon Demand forecast accuracy
  • Check Icon Fleet utilisation reporting
Systems and Standards We Connect
TMS and WMS data EDI 214 and 856 GPS and telematics feeds ERP procurement data

Insurance and InsurTech

Underwriting, claims, and actuarial teams often work from different versions of the same metrics. We bring policy, premium, and claims data into one governed analytics layer for consistent reporting and better decisions.

Explore →
Insurance Analytics
  • Check Icon Unified loss ratio definitions
  • Check Icon Claims severity and frequency
  • Check Icon Reserve adequacy monitoring
  • Check Icon Scored claims fraud signals
  • Check Icon Policy retention and lapses
  • Check Icon Broker performance reporting
  • Check Icon Regulatory reporting extracts
  • Check Icon Catastrophe exposure aggregation
Systems and Standards We Connect
Guidewire and Duck Creek ACORD standard data exchange Actuarial reserving model outputs Claims and FNOL platforms

Real Estate

Property, leasing, finance, and operations teams often work from disconnected systems. We bring property, tenant, financial, and market data together to give teams a consistent view of portfolio performance and investment decisions.

Explore →
Real Estate Analytics
  • Check Icon Property revenue analysis
  • Check Icon Occupancy rate tracking
  • Check Icon Lease expiry monitoring
  • Check Icon Tenant retention analysis
  • Check Icon Operating expense tracking
  • Check Icon Property valuation reporting
  • Check Icon Maintenance cost analysis
  • Check Icon Portfolio performance reporting
Systems and Standards We Connect
Yardi and MRI data Property management systems Lease administration platforms Accounting and ERP systems

Related Projects

View All Case Studies →
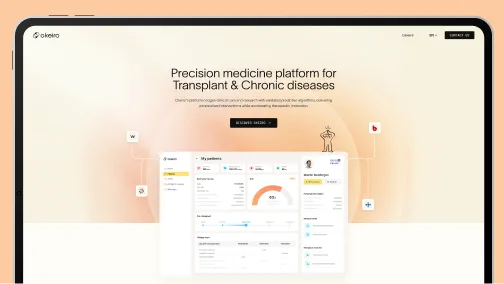
Okeiro

Okeiro

AI-enabled value-based care analytics platform linking clinical outcomes with operational and financial performance.

View Case Study →
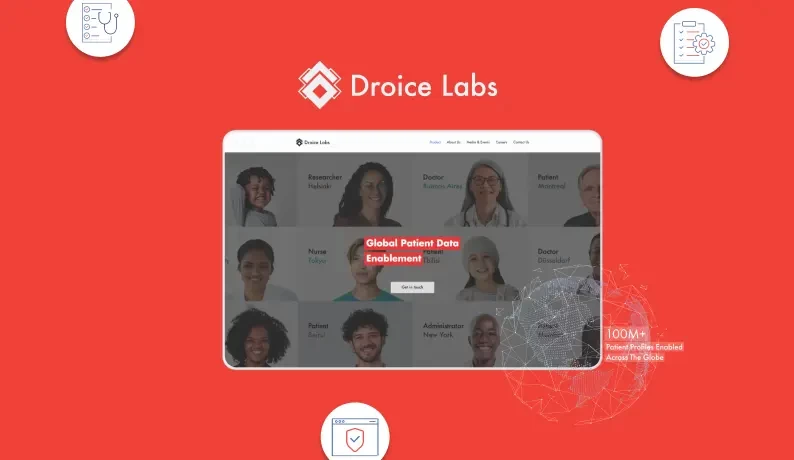
Droice Labs

Droice Labs

AI-based personal health monitoring and preventive care platform designed to transform diverse clinical and patient data into actionable insights.

View Case Study →
Berry Health

Berry Health

AI-enhanced telehealth diagnosis and treatment recommendation system for primary care delivery.

View Case Study →

What Drives BI Platform Costs

BI platform costs depend on more than the number of dashboards you need. User volumes, data complexity, refresh frequency, concurrency, platform capabilities, and future growth all influence the architecture and licensing model.

Key Cost Drivers

Per-user versus capacity licensing

Dashboard viewer requirements

Data volume and storage

Refresh frequency and workloads

Concurrent user demands

Semantic model requirements

Advanced analytics capabilities

Commercial versus open-source platforms

We assess these factors against your current workload and expected growth before recommending a platform and licensing approach. This helps avoid unnecessary costs while leaving enough capacity for adoption, data growth, and evolving analytics requirements.

Row Level Security and Audit Controls in Regulated Analytics

Access control that lives in individual reports breaks the first time someone clones a dashboard. Our business intelligence solutions enforce it in the semantic layer, where the rule travels with the answer regardless of which tool asked the question.

Row-level and column-level policies enforced at query time, not per report Full query audit trails covering human users and connected AI agents De-identified and masked environments for analytics and development work Certified versus experimental metric separation published in the catalogue

How We Build and Roll Out Business Intelligence Solutions

Every phase produces something your team keeps, including the definition documents and the semantic models, so the work holds value even if you change platform vendors later.

01

Metric and Source Audit

We inventory existing reports, record actual usage, and catalogue every conflicting definition of your core measures. Most estimates turn out to be a fifth as used as assumed.

02

Definition Sign-Off

Business owners are named against each metric and formally sign off the calculation. No modelling starts until finance, operations, and the analytics team agree on the numerator and denominator.

03

Warehouse and Pipeline Build

Source systems are integrated, models built, and pipelines instrumented with freshness alerting and schema-change detection so failures surface before a decision is made on stale data.

04

Semantic Layer Implementation

Signed-off definitions are implemented in Git-controlled semantic models with access policies attached, then validated against known-good historical figures before any report is built.

05

Rollout and Adoption Tracking

Reports ship to a pilot group first, usage telemetry is monitored past week four, and capacity is right-sized against real query load rather than a projected user count.

Client Testimonials (We're Rated 4.7 on Clutch)

How Much Does It Cost to Develop a BI Platform?

A departmental rollout on an existing warehouse typically runs $25,000 to $60,000 over six to ten weeks. A full enterprise build with pipelines, semantic layer, and migration usually lands between $80,000 and $200,000. We quote after the audit, not before.

Share your requirements to get an accurate estimate.


    Your data and info stays secure. Read our Privacy Policy.


    Why Enterprises Choose Citrusbug for Business Intelligence Solutions

    Metric definitions are signed off by named business owners before modelling starts, so disputes end in the semantic layer instead of a reconciliation meeting.

    Stalled BI programmes can be recovered without starting over. We audit what was built, keep what is salvageable, and restart delivery around what the business actually needs.

    Capacity and licence tiers are sized against measured concurrency and refresh load during discovery, so platform decisions are based on actual workloads rather than headcount assumptions.

    Our business intelligence consulting covers architecture, implementation, and governance while semantic models, pipeline code, and definition documentation are handed over in full at delivery, under NDA by default.

    Retalted insights

    VIEW ALL
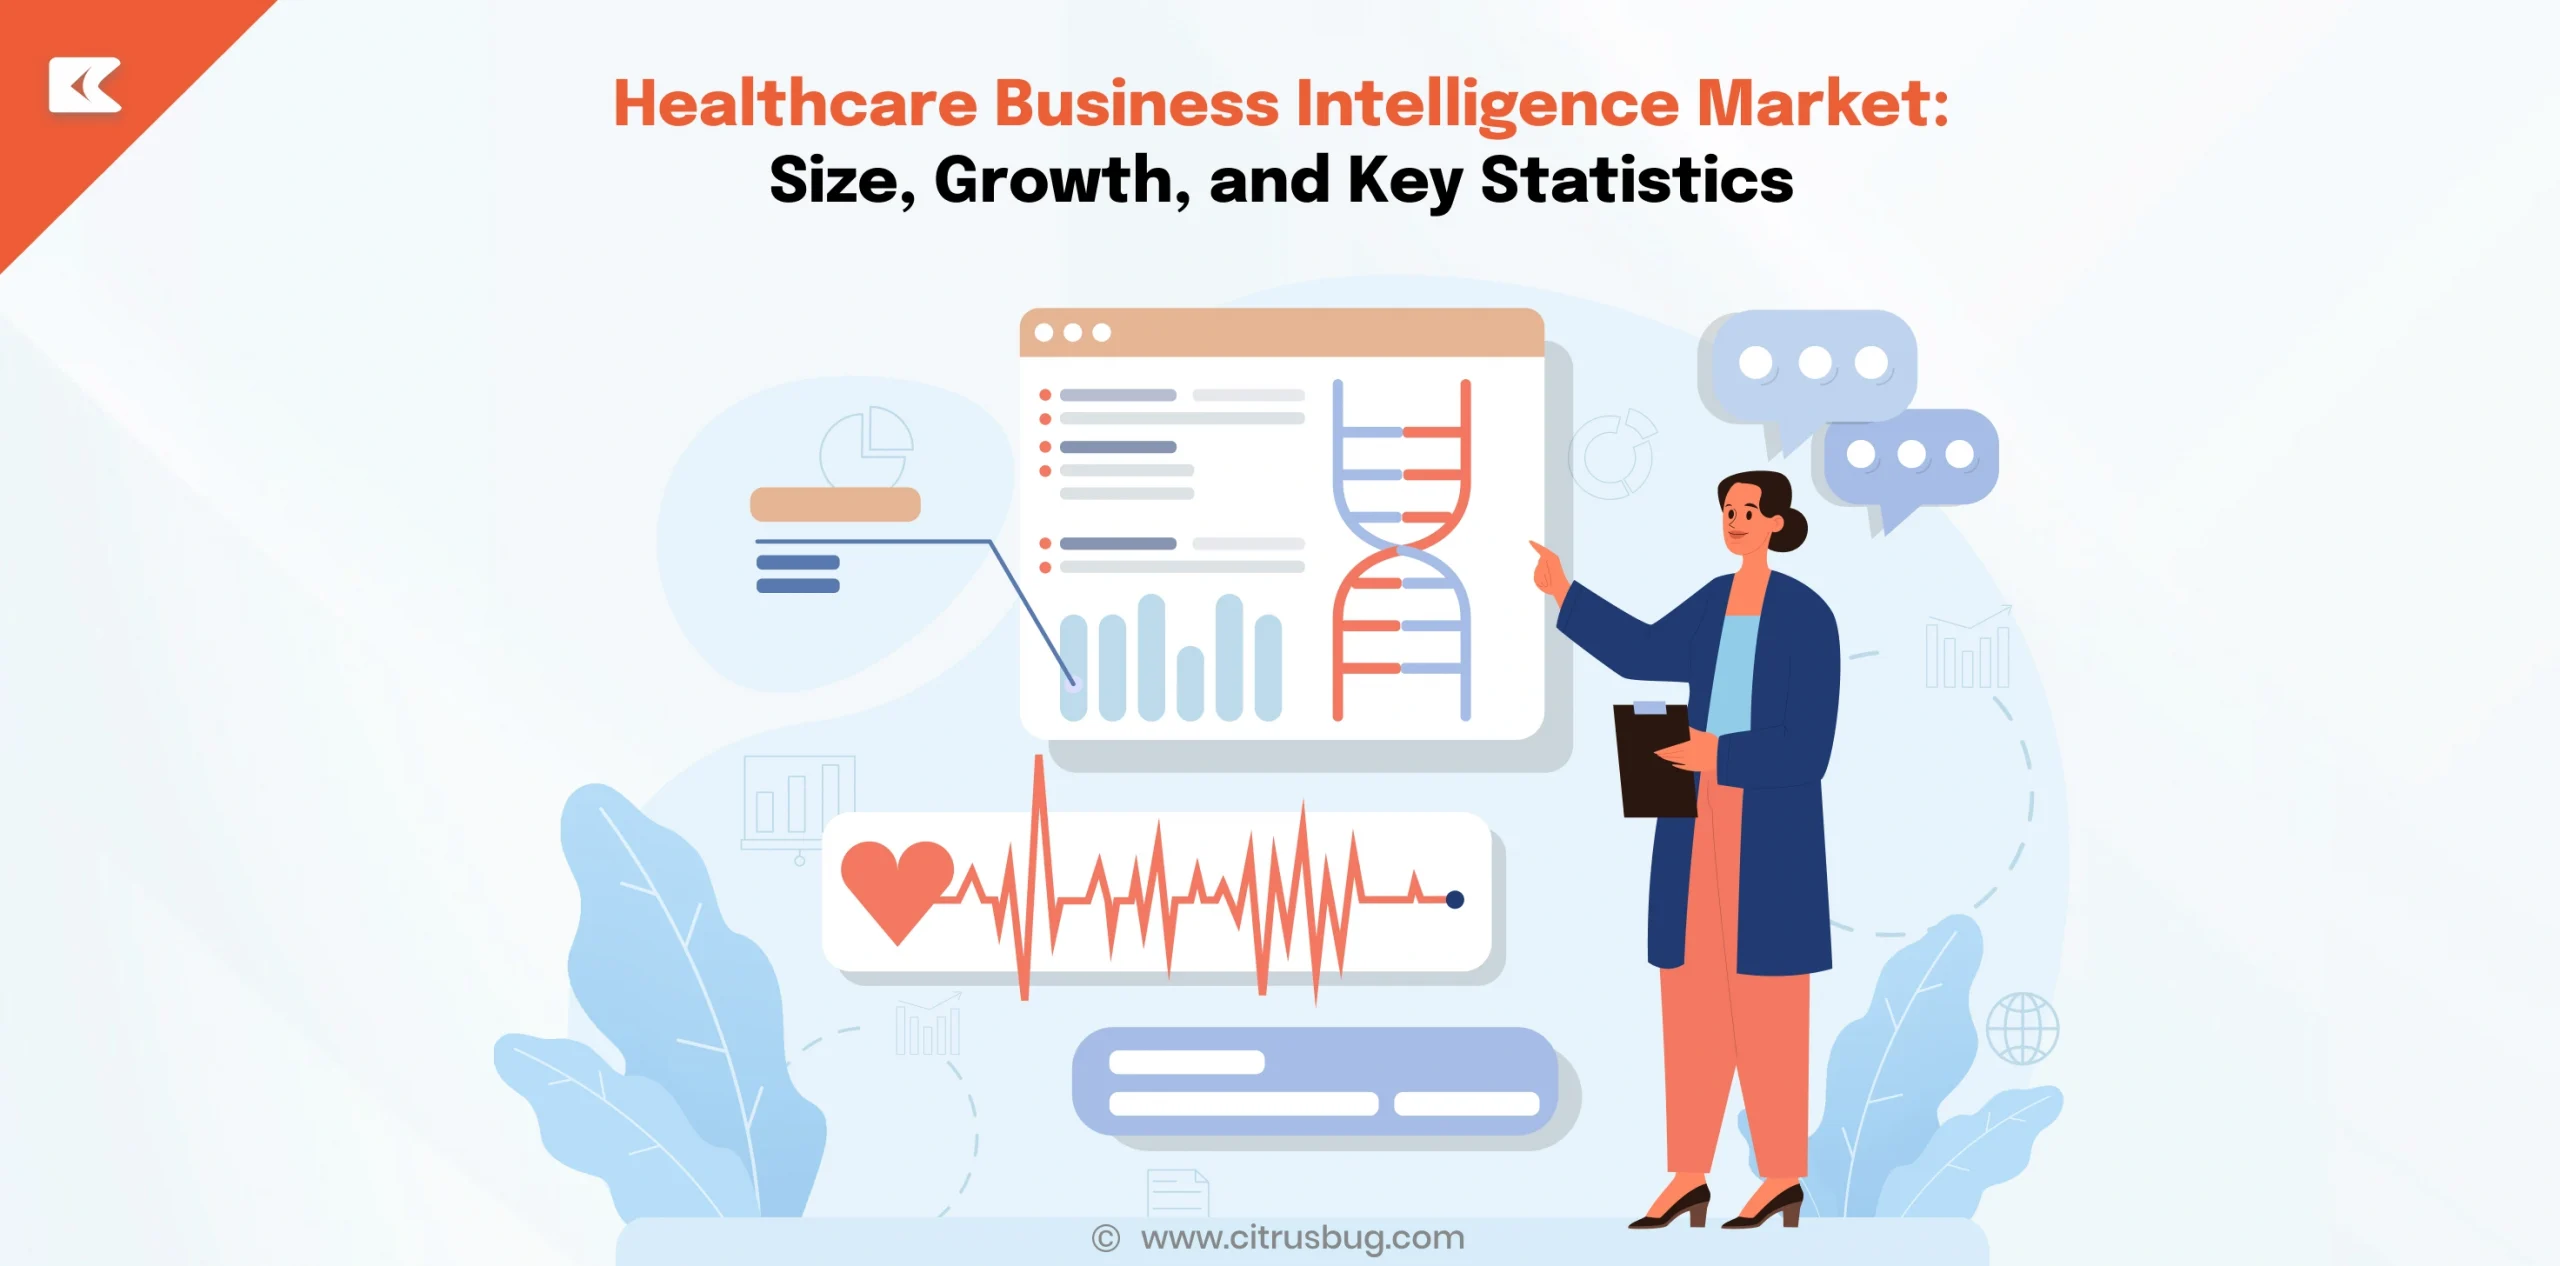
    Healthcare Business Intelligence Market: Size, Growth, and Key Statistics for 2026
    Healthcare Business Intelligence Market: Size, Growth, and Key Statistics for 2026 Artificial Intelligence

    Healthcare Business Intelligence Market: Size, Growth, and Key Statistics for 2026

    Introduction Healthcare organizations increasingly use data to aid in clinical, financial, and operational decision-making. With a growing amount of patient records, claims and administrative information, decision makers need context rather…

    Read Article →
    Why Invest in Custom Logistics Software Development for Your Business
    Why Invest in Custom Logistics Software Development for Your Business Custom Software Development

    Why Invest in Custom Logistics Software Development for Your Business

    In today’s fast-paced digital age, logistics companies face unprecedented demands. Consumers require quick, prompt, and hassle-free deliveries, and logistics organizations must align their operations and control their expenses while keeping…

    Read Article →
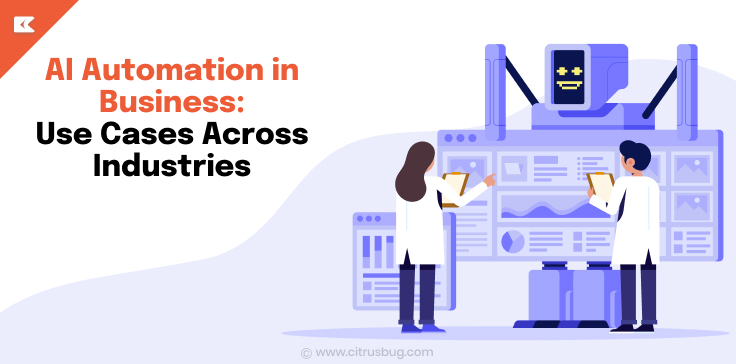
    AI Automation in Business: Use Cases Across Industries
    AI Automation in Business: Use Cases Across Industries Artificial Intelligence

    AI Automation in Business: Use Cases Across Industries

    What if your workflows ran themselves? Yes, AI is making it possible. From analyzing large datasets and adapting to new market trends to predicting future outcomes, AI has revolutionized how…

    Read Article →

    FAQs on Business Intelligence solutions

    What is the difference between business intelligence solutions and business intelligence services?

    Solutions are the platform you end up owning, from warehouse through semantic layer to reports. Services are the engineering and consulting work that builds and maintains it. Most engagements need both.

    How long before we see a working dashboard?

    A pilot dashboard on one signed-off metric set typically ships in four to six weeks. Full enterprise rollout runs one to two quarters, driven more by source system access than by build effort.

    Can you work with our existing Power BI or Tableau estate?

    Yes. We audit what is genuinely used, rebuild those assets against governed definitions, and retire the rest. Wholesale replacement is rarely necessary and usually the more expensive option.

    Do we need Microsoft Fabric to do this properly?

    No. Fabric makes sense for Microsoft-heavy organisations above roughly 400 consumers. Snowflake or Databricks with dbt and Metabase is often cheaper for smaller estates or multi-cloud requirements.

    Who owns the semantic models and pipeline code?

    You do, in full, at delivery. Everything sits in your Git repositories and your cloud accounts throughout the engagement, not in a vendor-controlled environment you lose access to.

    What happens if our previous BI vendor left the project half finished?

    We assess what was built, keep the salvageable pipelines and models, and restart from there. Roughly a third of our BI engagements begin this way rather than from a clean sheet.

    How do you keep costs predictable after go-live?

    Capacity tuning, refresh scheduling, and query cost monitoring are part of support. We flag runaway warehouse compute and unused licence seats monthly rather than at renewal.

    Can AI assistants query our data safely once this is built?

    Yes, provided they query the semantic layer rather than raw tables. Definitions and access policies are enforced at query time, so agent answers inherit the same rules your dashboards do.

    Build Smarter With BI

    Turn your business data into actionable insights with a BI solution built around your reporting and operational needs.